The Hypothesis LMS Reporting Dashboards provide instructors and school administrators with insights into student annotations and other data across assignments and courses. These dashboards facilitate seamless navigation between courses, providing the ability to filter and create custom views tailored to your specific reporting needs. Users can effortlessly save these customized views in their browser bookmarks, ensuring easy access for future reference.
For admins
Before you access the dashboards – designate one or more admins from your school
Access to the Hypothesis LMS Reporting Dashboards for school administrators will give you access to data from all courses within your institution. If your institution is partnered with Hypothesis then your primary school contact was sent an email from us asking to identify one or more users who should have administrator access within our app.
If you’re missing that email, you can request for admin access in the LMS Reporting Dashboard by completing the LMS Data Reporting Dashboards – request administrator access form.
Next – follow our instructor and admin steps below
School admin access to our dashboards is identical to instructor access, with the exception that it encompasses all courses within an institution. You will initially need at least one LMS course where you have instructor access, even a sandbox course. Alternatively, you can ask our team to give LMS admins the ability to launch Hypothesis assignments in your LMS instance.
Here’s a video to get started with the Hypothesis LMS Reporting Dashboards.
Read on to discover how to navigate our dashboards.
For instructors and admins
Accessing through an assignment
To initially access the LMS Reporting Dashboards you will need to launch the dashboards from within a Hypothesis assignment within your LMS. To do so:
- Open a Hypothesis assignment as an instructor within your LMS
- In the Hypothesis Sidebar, click on the Account icon (the person icon in the top-right)
- Click “Open dashboard”
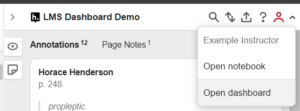
You’ll end up in the dashboards viewing the data for the assignment you were viewing in your LMS. To view other assignments and courses see Navigating within the dashboards.
Accessing through a URL
Once you’ve initially accessed the dashboard through an assignment you can come back to your dashboards without having to continually access through the LMS. You can visit https://lms.hypothes.is/dashboard to see your dashboard for all of your courses (you will not be able to access courses where you’re not a member), and to see specific assignments, sets of saved filters, and other views you can use your browser’s Bookmarks as detailed below.
After launching the Reporting Dashboard from within an LMS assignment, the URL access will last for one week. Every time you launch the dashboard URL your authentication is renewed and you have another week’s worth of access available. So you if you accessed the Dashboard every Monday, you would maintain URL access and not need to launch the Dashboards from within an LMS assignment again.
If your access ever expires, you can renew it by launching the Reporting Dashboards from within an LMS assignment again.
Navigating within the dashboards
The Assignment View
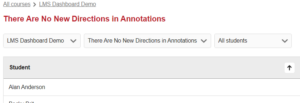
When you initially enter the dashboards from an LMS assignment, you’ll be viewing that same assignment in the Hypothesis dashboard. In the image below you can see the assignment title, “There Are No New Directions in Annotations”. Above it are links to the course name in the LMS, “LMS Dashboard Demo”, and a view where you can see “All courses” that you have access to as an instructor.
If you’re using our Auto Grading feature you will see an additional column called “Grade” in this view.
The Course View
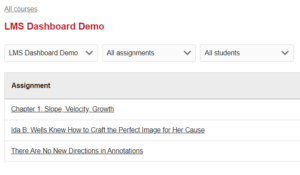
Clicking on the course name will bring you to a view where you can see all assignments within your course. Within this view you can click on any assignment name to enter the Assignment View, or you can click the “All courses” link to enter the All Courses View.
The All Courses View
Clicking on “All courses” will bring you to the top level of your dashboard view, where you will see a list of all of your courses where you’re using Hypothesis. This is identical to visiting https://lms.hypothes.is/dashboard.
Filtering your data
To organize and view your data in a variety of ways, we’ve added filters to the dashboard views. These filters will allow you to select Courses, Assignments, and Students.
Importantly, these filters react to each other; selecting a particular student will change the Courses and Assignments filters so that they only allow the selection of courses and assignments that the student has accessed.
When in the Assignment View, you can filter on individual students. Note that the Course and Assignment filters are pre-set to display the course this assignment is in, and the assignment itself.
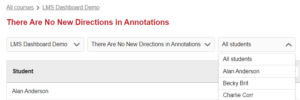
When in the Course View, you will be able to filter on Assignments and Students. Note that only the Course filter is pre-set.
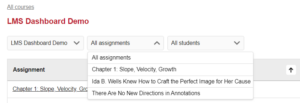
In the All Courses view, no filters are pre-set.

Bookmarking your dashboards to access them faster
Now that you’ve done the work of creating a set of filters in a view, you want to be able to revisit this without having to input it all over again. Saving a particular View or set of Filters is as easy as bookmarking the URL you’re currently on in your browser. The next time you open that exact URL you will be brought back to the same combination of View and Filters.
You can even share these bookmarks with users who have the same access to the LMS courses you have. For example, if you were co-teaching a course with another instructor, one instructor could create a dashboard link to the Course View with particular filters set, and the other instructor could use that link to see the same View (assuming they had already completed their initial dashboard access through an assignment).
How can I use this feature?
There are numerous scenarios where this data can be helpful. We’ve outlined a few ideas of our own, but please feel free to contribute your own ideas, and give us feedback, here.
For instructors
Quickly find students who are struggling with an assignment
To see who’s struggling, or who hasn’t started, any given assignment:
- Open the Assignment View for that particular assignment
- Click on the Annotations (or Replies) columns to sort by those columns
Look for students with few or no annotations and compare them to the rest of the class, then reach out directly to the student so you can offer annotation guidance.
Quickly check on an optimum time to add replies to student annotations
Bookmark the Assignment Views for your current assignments so it’s easy to check on them periodically. When you see the number of annotations begin to grow, especially if there’s a lack of replies, it may be time to open the assignment in your LMS and begin replying to the annotations that are there.
Your replies not only model the replies students can give, they’re an acknowledgement that the work students are doing matters, and can help motivate students who haven’t yet annotated to complete the work themselves. Reading replies also motivates students to revisit and re-read the text, ask questions, and generally evokes practices that lead to a deeper, more critical read.
Find your assignments with the most activity
Enter the dashboards and make sure you’re in a Course View. You can sort this view by number of Annotations, number of replies, and most recent assignment activity. Click on the appropriate column to find assignments with the most top level annotations, most student discussion through replies, or the most recent student annotation activity.
For admins
Share pre-made data views with instructors
As you and your instructors explore the data available at your institution, you can share with each other the views and filters you’ve been developing. Since school admins can see all courses, you can build a set of filters in any View and send the URL to an instructor who has access to the course’s data you’re trying to highlight. That instructor can open the URL (provided they’ve accessed the dashboards at least once already) and see the same view and filters (though they are restricted to only seeing data from courses where they are an instructor)
Finding annotation champions within your institution
Finding champions is simple with our dashboards! Simply head to the All Courses View, and sort by number of assignments. Open up the top handful of courses using Hypothesis assignments, and sort by number of Annotations and then number of Replies. You’ll quickly get a sense of who’s getting students annotating, and the types of assignments they’re using to do that.